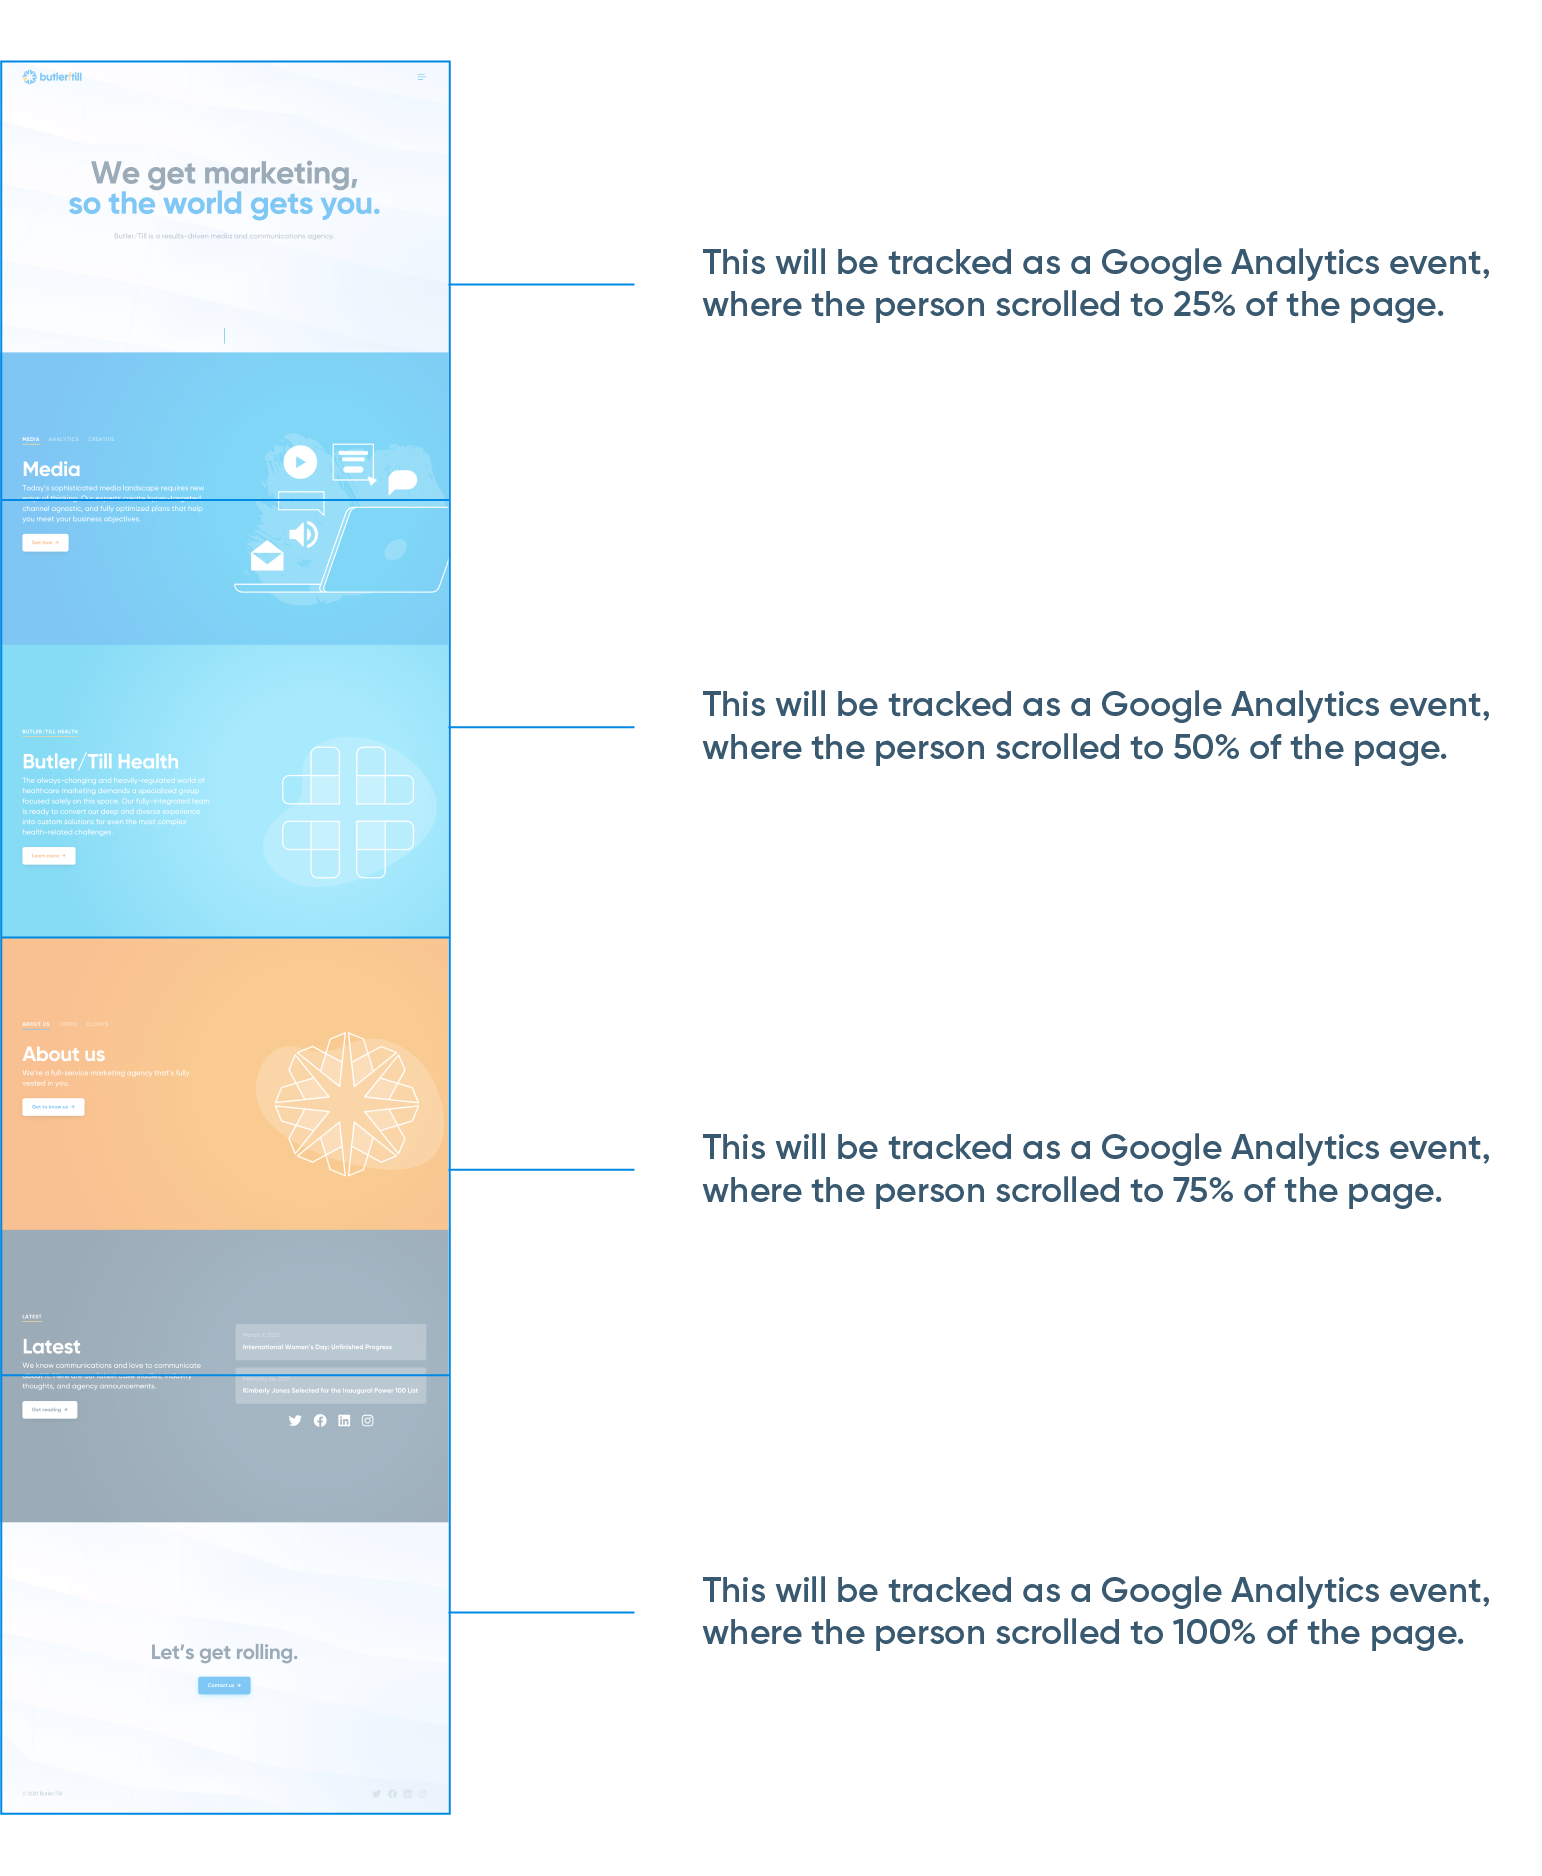
For clients that are interested in looking at measuring content interactions on their websites, Google Analytics offers Scroll Depth tracking, which is a Google Analytics event that is set up to track the depth in which users scroll on the webpage. There are scroll points 25%, 50%, 75%, and 100% of the webpage, sending a Google Analytics event for each one.

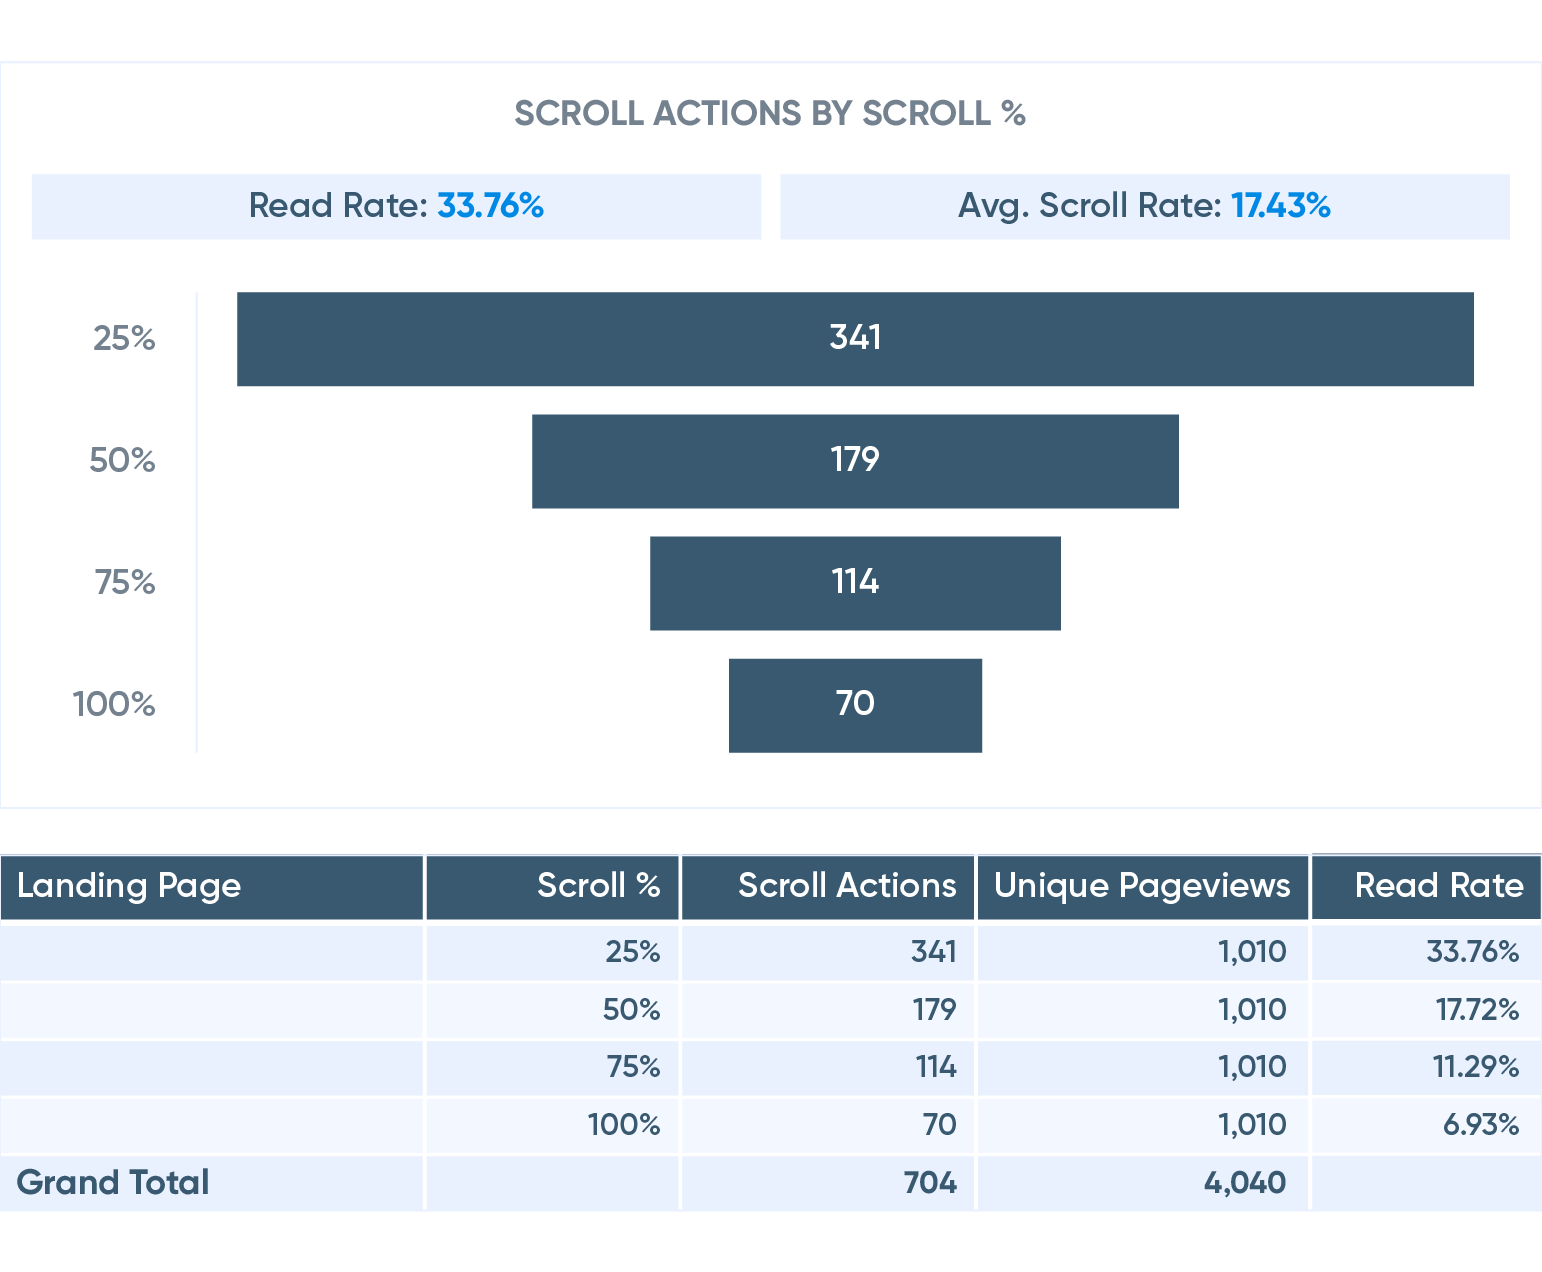
Needing to look deeper? Some clients use custom metrics for further tracking as well. The metrics that are used for these custom metrics create an Avg. Scroll Rate and Read Rate. Read Rate portrays the rate of non-click interactions with the page. While Avg. Scroll Rate portrays all the scroll event opportunities from Google Analytics over the Total Unique Pageviews.
The calculations being used are:
- Read Rate = Sum Scroll Opportunities Events at 25% / Total Unique Page Views
- Avg. Scroll Rate = Sum Scroll Opportunities Events at 25%, 50%, 75%, and 100% / Total Unique Pageviews
How Avg. Scroll Rate and Read Rate are reported:

So why does this matter?
These metrics are helping the team to understand how consumers are engaging with the long form content on the landing page. If a consumer scrolls to 100%, we can assume that the person has scrolled to read all the content on the landing page. By further calculating with the custom metrics of Read Rate and Avg. Scroll Rate, we are looking at the total Scroll Opportunities or Unique Pageviews to that landing page and comparing them to the total Google Analytics events within each scroll percentage.
For campaigns that have more than one landing page, we can also look at the performance between the two landing pages to get an understanding of which landing page consumers are interacting with more. We use the data from this analysis to compare to the site baselines to identify optimization needs.
These metrics provide insight into the non-interaction behavior of users on a landing page. This is a way to better understand how users move through a landing page, even if the results are no engagement at all.


